Image of tectonic plate boundaries from the National Park Service for comparison
https://www.nps.gov/subjects/geology/images/Fig-1-3-New-Tectonic-Map-x10.jpg
It has been a decade since the Great Tohoku Earthquake and Tsunami of 2011, in which so many people's lives perished and their homes destroyed. People are still recovering from that disaster. Earthquakes have caused extensive amounts of damage, deaths, and injuries all over the world. Analyzing earthquake data will help find patterns in earthquake occurrences, allowing people to identify which areas are at risk. It may also be used to influence building design decisions so that buildings can be built to be earthquake-resistant, minimizing damage and fatalities in the event of a earthquake. Earthquakes can also provide valuable insights into the movement of the earth's tectonic plates.
Most people have probably heard of the Richter scale, a scale used to measure earthquake magnitude. However, the Richter scale does not measure the magnitudes of very large earthquakes precisely and cannot be used to compare earthquakes around the world. Today, the preferred method of measuring earthquakes is the moment magnitude scale, Mw or Mww. This magnitude scale is applicable to a wide range of magnitudes and can be used globally. There are many other magnitude scales, each which measures something different. We're gonna say that the differences in magnitude scales in our data table aren't significant enough to do anything about it. Magnitude scales are logarithmic (base 10), meaning that the level of shaking increases by 10 times for each whole number you go up.
Magnitude scales can be confusing so you can read more about it here: https://www.usgs.gov/programs/earthquake-hazards/magnitude-types
I used data from the United States Geological Survey (USGS) at https://earthquake.usgs.gov/earthquakes/search/. Since search results were limited to 20,000 results, I decided to focus on earthquakes with larger magnitudes. I filtered out results by selecting events from across the world that occurred from 1900 onwards and had a minimum magnitude of 6.0. I selected the option to output results as a .csv file and then imported the data into a pandas DataFrame. This is what the first 5 rows of the dataset looks like.
import pandas as pd
import numpy as np
import matplotlib.pyplot as plt
%matplotlib inline

frame = pd.read_csv('query.csv')
frame
| time | latitude | longitude | depth | mag | magType | nst | gap | dmin | rms | ... | updated | place | type | horizontalError | depthError | magError | magNst | status | locationSource | magSource | |
|---|---|---|---|---|---|---|---|---|---|---|---|---|---|---|---|---|---|---|---|---|---|
| 0 | 2021-12-16T21:14:46.597Z | -60.1796 | -23.8016 | 15.00 | 6.00 | mww | NaN | 45.0 | 9.059 | 0.84 | ... | 2021-12-17T21:19:11.619Z | South Sandwich Islands region | earthquake | 9.9 | 1.7 | 0.052 | 36.0 | reviewed | us | us |
| 1 | 2021-12-14T03:20:24.009Z | -7.6302 | 122.2311 | 16.08 | 7.30 | mww | NaN | 41.0 | 0.999 | 0.49 | ... | 2021-12-17T01:29:08.294Z | Flores Sea | earthquake | 5.1 | 2.7 | 0.055 | 32.0 | reviewed | us | us |
| 2 | 2021-12-12T08:58:08.178Z | -60.6915 | 154.1065 | 10.00 | 6.50 | mww | NaN | 129.0 | 6.732 | 0.64 | ... | 2021-12-13T18:08:12.040Z | west of Macquarie Island | earthquake | 9.0 | 1.8 | 0.093 | 11.0 | reviewed | us | us |
| 3 | 2021-12-09T02:05:07.709Z | 29.4428 | 129.3791 | 7.00 | 6.00 | mww | NaN | 24.0 | 2.258 | 0.65 | ... | 2021-12-14T12:10:44.787Z | 119 km N of Naze, Japan | earthquake | 5.8 | 1.1 | 0.055 | 32.0 | reviewed | us | us |
| 4 | 2021-12-04T23:47:57.708Z | 4.0681 | 128.1359 | 174.26 | 6.00 | mww | NaN | 25.0 | 3.363 | 0.96 | ... | 2021-12-07T15:45:00.040Z | 259 km N of Tobelo, Indonesia | earthquake | 6.0 | 4.5 | 0.050 | 39.0 | reviewed | us | us |
| ... | ... | ... | ... | ... | ... | ... | ... | ... | ... | ... | ... | ... | ... | ... | ... | ... | ... | ... | ... | ... | ... |
| 11827 | 1901-08-09T13:01:00.000Z | -22.0000 | 170.0000 | 0.00 | 7.90 | mw | NaN | NaN | NaN | NaN | ... | 2020-07-09T21:51:40.428Z | 224 km ESE of Tadine, New Caledonia | earthquake | NaN | NaN | NaN | NaN | automatic | iscgem | iscgem |
| 11828 | 1901-03-03T07:45:00.000Z | 36.0000 | -120.5000 | NaN | 6.40 | ms | NaN | NaN | NaN | NaN | ... | 2018-06-04T20:43:44.000Z | 12 km NNW of Parkfield, California | earthquake | NaN | NaN | NaN | NaN | reviewed | ushis | ell |
| 11829 | 1900-10-29T09:11:00.000Z | 11.0000 | -66.0000 | 0.00 | 7.70 | mw | NaN | NaN | NaN | NaN | ... | 2020-07-09T21:50:47.628Z | 83 km NE of Guatire, Venezuela | earthquake | NaN | NaN | NaN | NaN | automatic | iscgem | iscgem |
| 11830 | 1900-10-09T12:25:00.000Z | 57.0900 | -153.4800 | NaN | 7.86 | mw | NaN | NaN | NaN | NaN | ... | 2019-05-02T20:46:08.555Z | 16 km SW of Old Harbor, Alaska | earthquake | NaN | NaN | NaN | NaN | reviewed | ushis | pt |
| 11831 | 1900-07-29T06:59:00.000Z | -10.0000 | 165.0000 | 0.00 | 7.60 | mw | NaN | NaN | NaN | NaN | ... | 2020-07-09T21:50:21.653Z | 118 km NW of Lata, Solomon Islands | earthquake | NaN | NaN | NaN | NaN | automatic | iscgem | iscgem |
11832 rows × 22 columns
Let's make sure that the data we're looking at is actually earthquakes and not something else such as an underground nuclear bomb test. We can also remove many of the columns in the data table since they won't be relevant to the analysis.
frame = frame.loc[frame['type'] == 'earthquake']
frame = frame.drop(columns=['status','locationSource','magSource','net','nst'])
# Converting the time column into datetime format for easier manipulation later
frame['datetime'] = pd.to_datetime(frame['time'])
In order to see which areas are at most risk of major earthquakes, I used a heatmap from Google Maps to display which areas had frequent earthquake events.
# These terminal commands, denoted by the exclamation mark, will be executed to allow Google Maps to run properly.
# If the Google Maps figure doesn't show up in the Jupyter notebook, try setting the notebook as Trusted.
!jupyter nbextension enable --py gmaps
!pip install gmaps
!jupyter nbextension enable --py --sys-prefix widgetsnbextension
import gmaps
import gmaps.datasets
# Get your own Google Maps Javascript API key if you don't have one. You need one to use the gmaps library.
gmaps.configure(api_key = "AIzaSyBNaQGPnt3B0a5fe_C8ZwKbiJ_8stuJFHs")
Enabling notebook extension jupyter-gmaps/extension...
      - Validating: OK
Requirement already satisfied: gmaps in /opt/conda/lib/python3.8/site-packages (0.9.0)
Requirement already satisfied: six in /opt/conda/lib/python3.8/site-packages (from gmaps) (1.15.0)
Requirement already satisfied: ipython>=5.3.0 in /opt/conda/lib/python3.8/site-packages (from gmaps) (7.19.0)
Requirement already satisfied: ipywidgets>=7.0.0 in /opt/conda/lib/python3.8/site-packages (from gmaps) (7.6.3)
Requirement already satisfied: geojson>=2.0.0 in /opt/conda/lib/python3.8/site-packages (from gmaps) (2.5.0)
Requirement already satisfied: traitlets>=4.3.0 in /opt/conda/lib/python3.8/site-packages (from gmaps) (5.0.5)
Requirement already satisfied: pickleshare in /opt/conda/lib/python3.8/site-packages (from ipython>=5.3.0->gmaps) (0.7.5)
Requirement already satisfied: decorator in /opt/conda/lib/python3.8/site-packages (from ipython>=5.3.0->gmaps) (4.4.2)
Requirement already satisfied: pexpect>4.3 in /opt/conda/lib/python3.8/site-packages (from ipython>=5.3.0->gmaps) (4.8.0)
Requirement already satisfied: setuptools>=18.5 in /opt/conda/lib/python3.8/site-packages (from ipython>=5.3.0->gmaps) (49.6.0.post20210108)
Requirement already satisfied: backcall in /opt/conda/lib/python3.8/site-packages (from ipython>=5.3.0->gmaps) (0.2.0)
Requirement already satisfied: pygments in /opt/conda/lib/python3.8/site-packages (from ipython>=5.3.0->gmaps) (2.7.4)
Requirement already satisfied: jedi>=0.10 in /opt/conda/lib/python3.8/site-packages (from ipython>=5.3.0->gmaps) (0.17.2)
Requirement already satisfied: prompt-toolkit!=3.0.0,!=3.0.1,<3.1.0,>=2.0.0 in /opt/conda/lib/python3.8/site-packages (from ipython>=5.3.0->gmaps) (3.0.10)
Requirement already satisfied: jupyterlab-widgets>=1.0.0 in /opt/conda/lib/python3.8/site-packages (from ipywidgets>=7.0.0->gmaps) (1.0.0)
Requirement already satisfied: ipykernel>=4.5.1 in /opt/conda/lib/python3.8/site-packages (from ipywidgets>=7.0.0->gmaps) (5.4.2)
Requirement already satisfied: nbformat>=4.2.0 in /opt/conda/lib/python3.8/site-packages (from ipywidgets>=7.0.0->gmaps) (5.1.2)
Requirement already satisfied: widgetsnbextension~=3.5.0 in /opt/conda/lib/python3.8/site-packages (from ipywidgets>=7.0.0->gmaps) (3.5.1)
Requirement already satisfied: tornado>=4.2 in /opt/conda/lib/python3.8/site-packages (from ipykernel>=4.5.1->ipywidgets>=7.0.0->gmaps) (6.1)
Requirement already satisfied: jupyter-client in /opt/conda/lib/python3.8/site-packages (from ipykernel>=4.5.1->ipywidgets>=7.0.0->gmaps) (6.1.11)
Requirement already satisfied: parso<0.8.0,>=0.7.0 in /opt/conda/lib/python3.8/site-packages (from jedi>=0.10->ipython>=5.3.0->gmaps) (0.7.1)
Requirement already satisfied: ipython-genutils in /opt/conda/lib/python3.8/site-packages (from nbformat>=4.2.0->ipywidgets>=7.0.0->gmaps) (0.2.0)
Requirement already satisfied: jupyter-core in /opt/conda/lib/python3.8/site-packages (from nbformat>=4.2.0->ipywidgets>=7.0.0->gmaps) (4.7.0)
Requirement already satisfied: jsonschema!=2.5.0,>=2.4 in /opt/conda/lib/python3.8/site-packages (from nbformat>=4.2.0->ipywidgets>=7.0.0->gmaps) (3.2.0)
Requirement already satisfied: pyrsistent>=0.14.0 in /opt/conda/lib/python3.8/site-packages (from jsonschema!=2.5.0,>=2.4->nbformat>=4.2.0->ipywidgets>=7.0.0->gmaps) (0.17.3)
Requirement already satisfied: attrs>=17.4.0 in /opt/conda/lib/python3.8/site-packages (from jsonschema!=2.5.0,>=2.4->nbformat>=4.2.0->ipywidgets>=7.0.0->gmaps) (20.3.0)
Requirement already satisfied: ptyprocess>=0.5 in /opt/conda/lib/python3.8/site-packages (from pexpect>4.3->ipython>=5.3.0->gmaps) (0.7.0)
Requirement already satisfied: wcwidth in /opt/conda/lib/python3.8/site-packages (from prompt-toolkit!=3.0.0,!=3.0.1,<3.1.0,>=2.0.0->ipython>=5.3.0->gmaps) (0.2.5)
Requirement already satisfied: notebook>=4.4.1 in /opt/conda/lib/python3.8/site-packages (from widgetsnbextension~=3.5.0->ipywidgets>=7.0.0->gmaps) (6.2.0)
Requirement already satisfied: nbconvert in /opt/conda/lib/python3.8/site-packages (from notebook>=4.4.1->widgetsnbextension~=3.5.0->ipywidgets>=7.0.0->gmaps) (6.0.7)
Requirement already satisfied: pyzmq>=17 in /opt/conda/lib/python3.8/site-packages (from notebook>=4.4.1->widgetsnbextension~=3.5.0->ipywidgets>=7.0.0->gmaps) (21.0.1)
Requirement already satisfied: jinja2 in /opt/conda/lib/python3.8/site-packages (from notebook>=4.4.1->widgetsnbextension~=3.5.0->ipywidgets>=7.0.0->gmaps) (2.11.2)
Requirement already satisfied: argon2-cffi in /opt/conda/lib/python3.8/site-packages (from notebook>=4.4.1->widgetsnbextension~=3.5.0->ipywidgets>=7.0.0->gmaps) (20.1.0)
Requirement already satisfied: Send2Trash>=1.5.0 in /opt/conda/lib/python3.8/site-packages (from notebook>=4.4.1->widgetsnbextension~=3.5.0->ipywidgets>=7.0.0->gmaps) (1.5.0)
Requirement already satisfied: terminado>=0.8.3 in /opt/conda/lib/python3.8/site-packages (from notebook>=4.4.1->widgetsnbextension~=3.5.0->ipywidgets>=7.0.0->gmaps) (0.9.2)
Requirement already satisfied: prometheus-client in /opt/conda/lib/python3.8/site-packages (from notebook>=4.4.1->widgetsnbextension~=3.5.0->ipywidgets>=7.0.0->gmaps) (0.9.0)
Requirement already satisfied: python-dateutil>=2.1 in /opt/conda/lib/python3.8/site-packages (from jupyter-client->ipykernel>=4.5.1->ipywidgets>=7.0.0->gmaps) (2.8.1)
Requirement already satisfied: cffi>=1.0.0 in /opt/conda/lib/python3.8/site-packages (from argon2-cffi->notebook>=4.4.1->widgetsnbextension~=3.5.0->ipywidgets>=7.0.0->gmaps) (1.14.4)
Requirement already satisfied: pycparser in /opt/conda/lib/python3.8/site-packages (from cffi>=1.0.0->argon2-cffi->notebook>=4.4.1->widgetsnbextension~=3.5.0->ipywidgets>=7.0.0->gmaps) (2.20)
Requirement already satisfied: MarkupSafe>=0.23 in /opt/conda/lib/python3.8/site-packages (from jinja2->notebook>=4.4.1->widgetsnbextension~=3.5.0->ipywidgets>=7.0.0->gmaps) (1.1.1)
Requirement already satisfied: pandocfilters>=1.4.1 in /opt/conda/lib/python3.8/site-packages (from nbconvert->notebook>=4.4.1->widgetsnbextension~=3.5.0->ipywidgets>=7.0.0->gmaps) (1.4.2)
Requirement already satisfied: entrypoints>=0.2.2 in /opt/conda/lib/python3.8/site-packages (from nbconvert->notebook>=4.4.1->widgetsnbextension~=3.5.0->ipywidgets>=7.0.0->gmaps) (0.3)
Requirement already satisfied: testpath in /opt/conda/lib/python3.8/site-packages (from nbconvert->notebook>=4.4.1->widgetsnbextension~=3.5.0->ipywidgets>=7.0.0->gmaps) (0.4.4)
Requirement already satisfied: defusedxml in /opt/conda/lib/python3.8/site-packages (from nbconvert->notebook>=4.4.1->widgetsnbextension~=3.5.0->ipywidgets>=7.0.0->gmaps) (0.6.0)
Requirement already satisfied: nbclient<0.6.0,>=0.5.0 in /opt/conda/lib/python3.8/site-packages (from nbconvert->notebook>=4.4.1->widgetsnbextension~=3.5.0->ipywidgets>=7.0.0->gmaps) (0.5.1)
Requirement already satisfied: bleach in /opt/conda/lib/python3.8/site-packages (from nbconvert->notebook>=4.4.1->widgetsnbextension~=3.5.0->ipywidgets>=7.0.0->gmaps) (3.2.1)
Requirement already satisfied: mistune<2,>=0.8.1 in /opt/conda/lib/python3.8/site-packages (from nbconvert->notebook>=4.4.1->widgetsnbextension~=3.5.0->ipywidgets>=7.0.0->gmaps) (0.8.4)
Requirement already satisfied: jupyterlab-pygments in /opt/conda/lib/python3.8/site-packages (from nbconvert->notebook>=4.4.1->widgetsnbextension~=3.5.0->ipywidgets>=7.0.0->gmaps) (0.1.2)
Requirement already satisfied: nest-asyncio in /opt/conda/lib/python3.8/site-packages (from nbclient<0.6.0,>=0.5.0->nbconvert->notebook>=4.4.1->widgetsnbextension~=3.5.0->ipywidgets>=7.0.0->gmaps) (1.4.3)
Requirement already satisfied: async-generator in /opt/conda/lib/python3.8/site-packages (from nbclient<0.6.0,>=0.5.0->nbconvert->notebook>=4.4.1->widgetsnbextension~=3.5.0->ipywidgets>=7.0.0->gmaps) (1.10)
Requirement already satisfied: packaging in /opt/conda/lib/python3.8/site-packages (from bleach->nbconvert->notebook>=4.4.1->widgetsnbextension~=3.5.0->ipywidgets>=7.0.0->gmaps) (20.8)
Requirement already satisfied: webencodings in /opt/conda/lib/python3.8/site-packages (from bleach->nbconvert->notebook>=4.4.1->widgetsnbextension~=3.5.0->ipywidgets>=7.0.0->gmaps) (0.5.1)
Requirement already satisfied: pyparsing>=2.0.2 in /opt/conda/lib/python3.8/site-packages (from packaging->bleach->nbconvert->notebook>=4.4.1->widgetsnbextension~=3.5.0->ipywidgets>=7.0.0->gmaps) (2.4.7)
Enabling notebook extension jupyter-js-widgets/extension...
      - Validating: OK
# Taking the latitude and longitude columns and converting it into an array of two element arrays to contain coordinates.
latitude = np.array(frame['latitude'])
longitude = np.array(frame['longitude'])
coord = np.array((latitude,longitude)).T
coord[0:9]
array([[ -60.1796,  -23.8016],
       [  -7.6302,  122.2311],
       [ -60.6915,  154.1065],
       [  29.4428,  129.3791],
       [   4.0681,  128.1359],
       [ -60.4652,  -27.1401],
       [ -28.6292, -112.2613],
       [  -3.5972,  151.3388],
       [  -3.5165,  151.1803]])
fig = gmaps.figure()
fig.add_layer(gmaps.heatmap_layer(coord))
fig
temp = frame.loc[frame['mag'] >= 7.0]
latitude = np.array(temp['latitude'])
longitude = np.array(temp['longitude'])
coord = np.array((latitude,longitude)).T
fig = gmaps.figure()
fig.add_layer(gmaps.heatmap_layer(coord))
fig
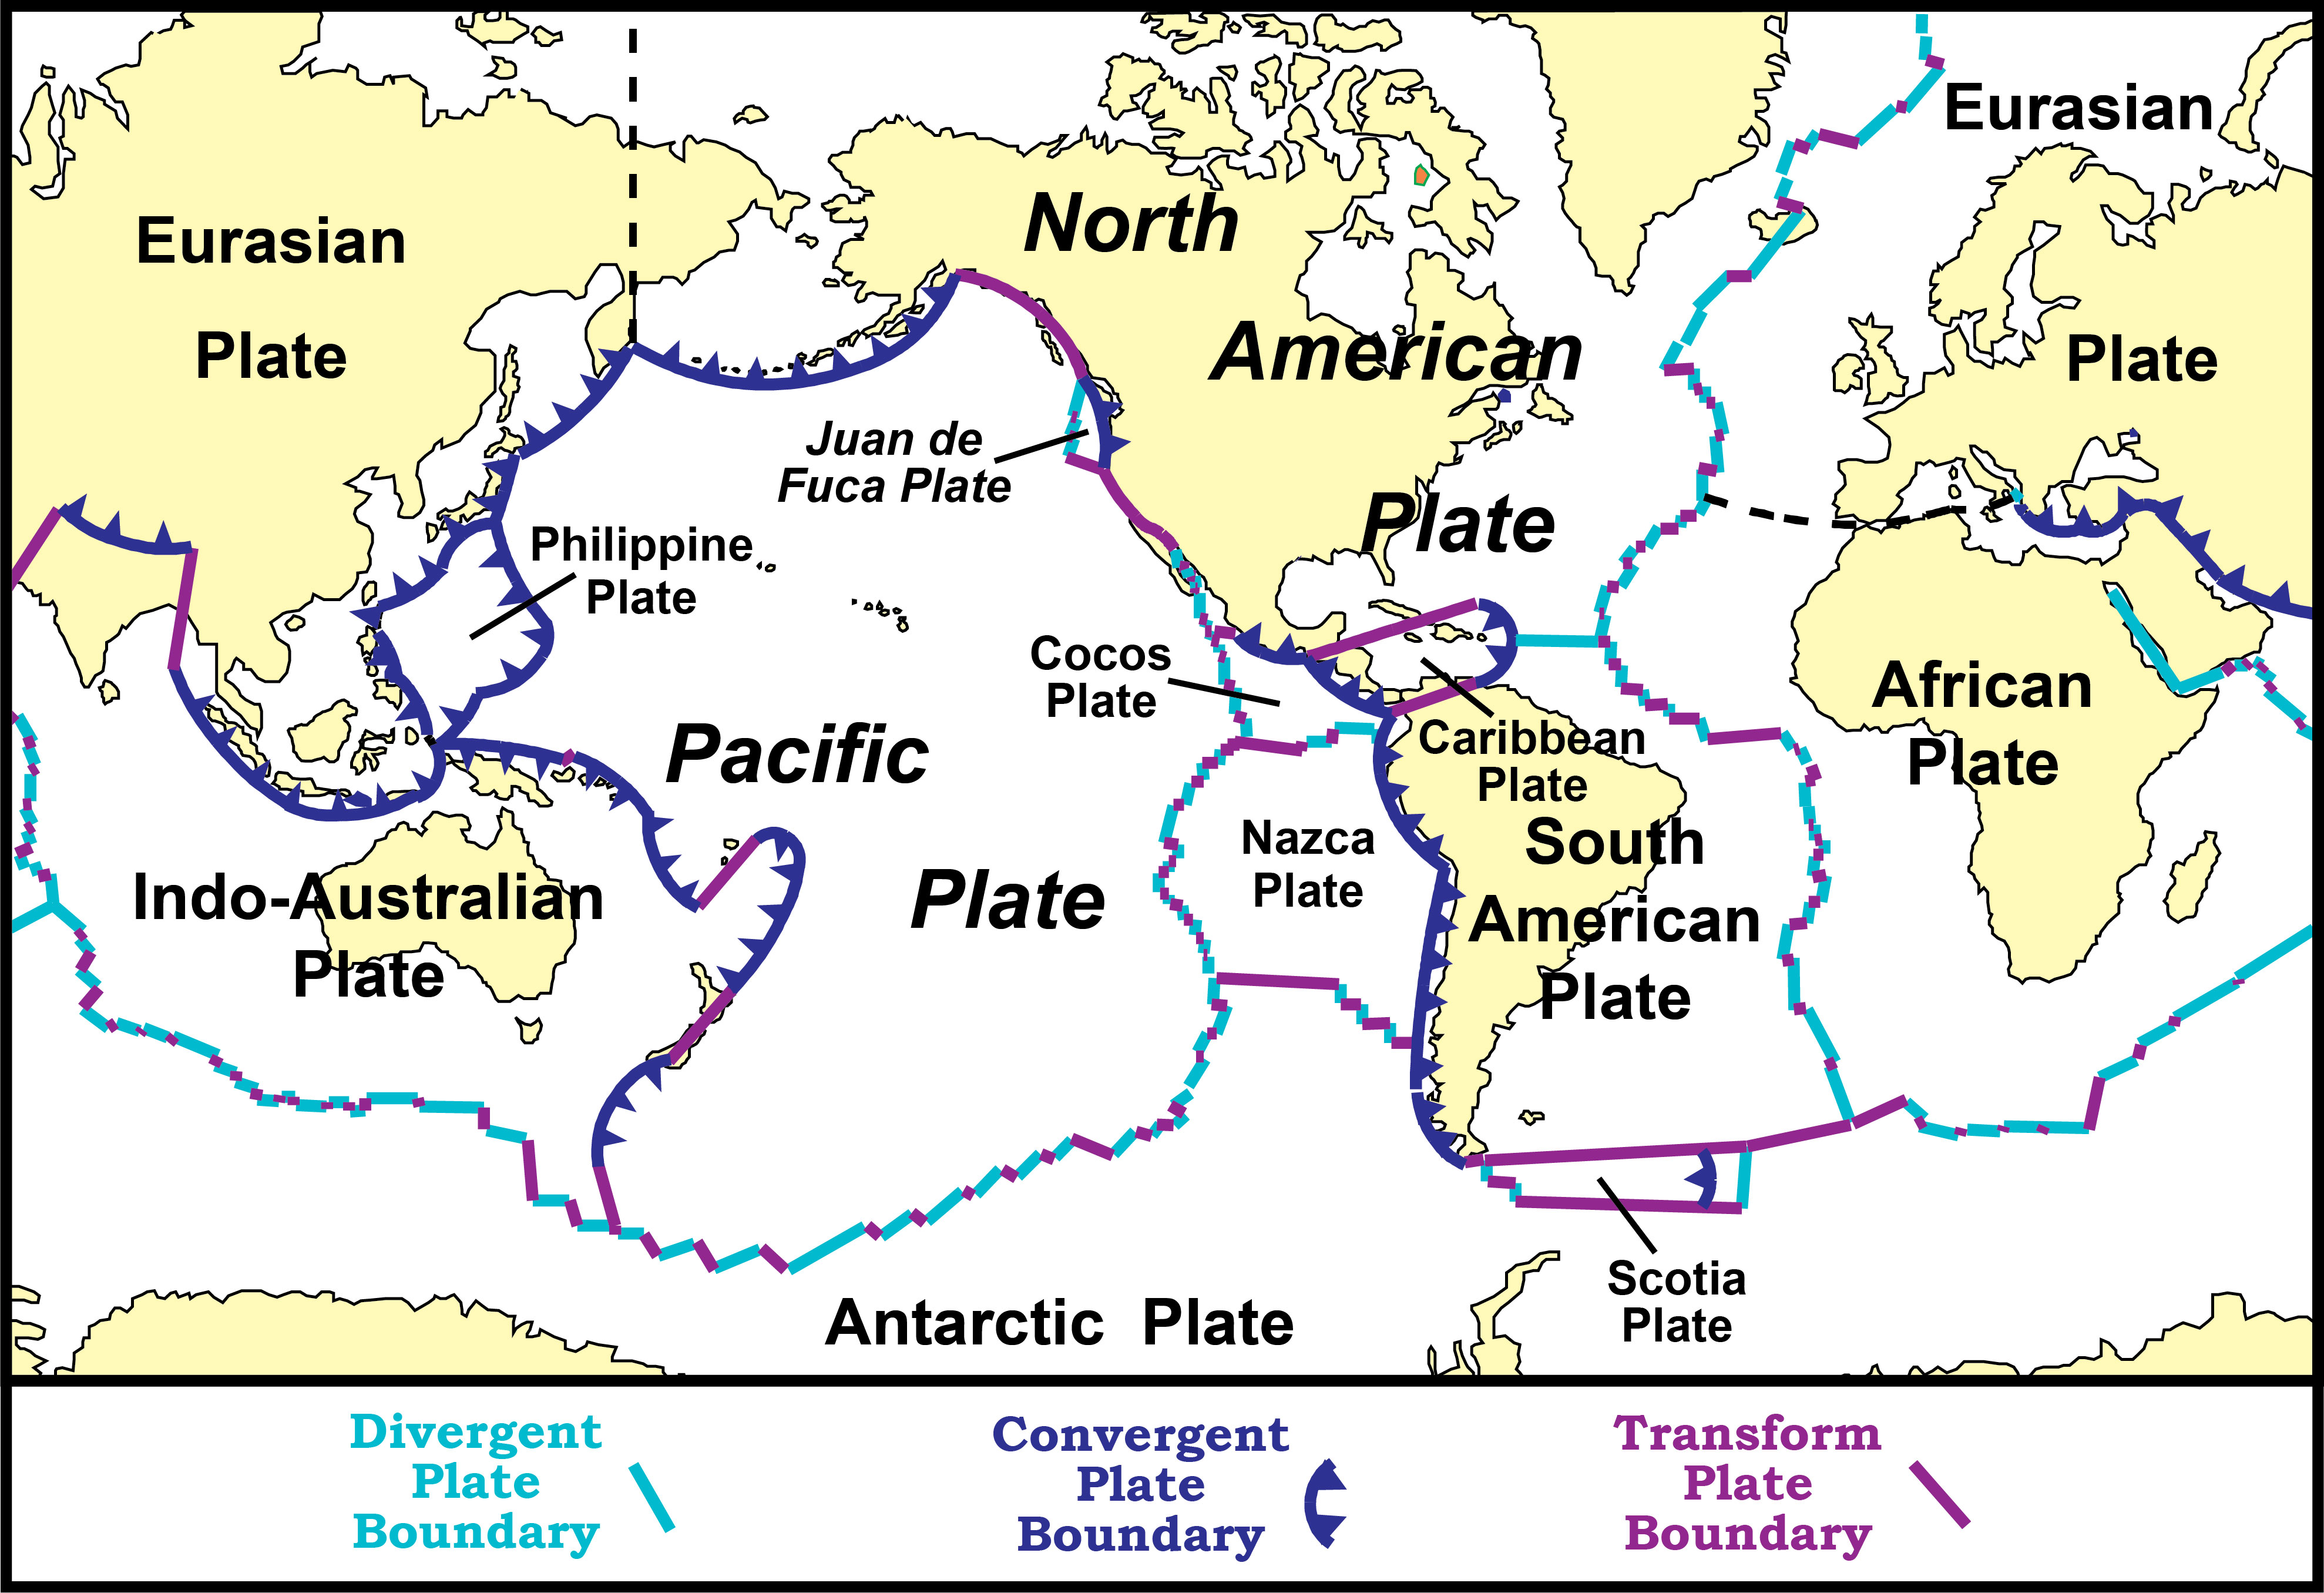
https://www.nps.gov/subjects/geology/images/Fig-1-3-New-Tectonic-Map-x10.jpg
The most frequent area of large earthquakes is around the Ring of Fire, which is a belt consisting of several tectonic plate boundaries. The Ring of Fire stretches from the tip of South America to Alaska, and from Alaska to the Philippines and from the Philippines through New Zealand to the Antarctic Plate. From comparing the plate boundaries map and earthquake locations, it appears that the type of plate boundary has a relationship with the frequency of earthquakes. The Ring of Fire consists of mostly convergent boundaries while being the location of most of the world's earthquakes. And even within the Ring of Fire, areas that aren't convegent plate boundaries, such the coast of California, have less large earthquakes.
I also noticed that there are some earthquakes that don't occur right at a plate boundary, but somewhat close to one. Examining the heatmap of 7.0+ earthquakes, there are multiple earthquakes in Western China, north of the plate boundary at the Himalayan mountains. Another example is the earthquakes that occured inland of South America, east of the coast where the plate boundary is and east of the Andes mountains. In both of these cases, the plate boundaries are near major mountain ranges. This leads me to hypothesize that the large amounts of stress on the tectonic plates, indicated by the mountain ranges, is enough to cause earthquakes farther away.
More resources on the different types of plate boundaries:
Knowing how often earthquakes occur is important for warning against future earthquakes. To start, let's just plot the earthquake magnitudes against time to see if there's any patterns in the data. The frequency of earthquakes should be independent of time but let's see.
plt.figure(figsize=(20,10))
plt.plot(frame['datetime'], frame['mag'], 'go', markersize=1)
plt.xlabel('Year')
plt.ylabel('Magnitude')
plt.title('Distribution of Earthquakes')
plt.show()

There are a lot more data points after 1950 as well as a much different distribution of points. This is most likely because that is when they started to record earthquakes more regularly. To make sure the data is consistent, let's remove all of the data points before 1950.
import datetime
after1950 = frame.loc[frame['datetime'] > datetime.datetime(1950,1,1,0,0,tzinfo=datetime.timezone(datetime.timedelta(0)))]
after1950
| time | latitude | longitude | depth | mag | magType | gap | dmin | rms | id | updated | place | type | horizontalError | depthError | magError | magNst | datetime | |
|---|---|---|---|---|---|---|---|---|---|---|---|---|---|---|---|---|---|---|
| 0 | 2021-12-16T21:14:46.597Z | -60.1796 | -23.8016 | 15.00 | 6.0 | mww | 45.0 | 9.059 | 0.84 | us6000gcxa | 2021-12-17T21:19:11.619Z | South Sandwich Islands region | earthquake | 9.9 | 1.7 | 0.052 | 36.0 | 2021-12-16 21:14:46.597000+00:00 |
| 1 | 2021-12-14T03:20:24.009Z | -7.6302 | 122.2311 | 16.08 | 7.3 | mww | 41.0 | 0.999 | 0.49 | us6000gc2a | 2021-12-17T01:29:08.294Z | Flores Sea | earthquake | 5.1 | 2.7 | 0.055 | 32.0 | 2021-12-14 03:20:24.009000+00:00 |
| 2 | 2021-12-12T08:58:08.178Z | -60.6915 | 154.1065 | 10.00 | 6.5 | mww | 129.0 | 6.732 | 0.64 | us6000gbls | 2021-12-13T18:08:12.040Z | west of Macquarie Island | earthquake | 9.0 | 1.8 | 0.093 | 11.0 | 2021-12-12 08:58:08.178000+00:00 |
| 3 | 2021-12-09T02:05:07.709Z | 29.4428 | 129.3791 | 7.00 | 6.0 | mww | 24.0 | 2.258 | 0.65 | us6000gaq5 | 2021-12-14T12:10:44.787Z | 119 km N of Naze, Japan | earthquake | 5.8 | 1.1 | 0.055 | 32.0 | 2021-12-09 02:05:07.709000+00:00 |
| 4 | 2021-12-04T23:47:57.708Z | 4.0681 | 128.1359 | 174.26 | 6.0 | mww | 25.0 | 3.363 | 0.96 | us6000g944 | 2021-12-07T15:45:00.040Z | 259 km N of Tobelo, Indonesia | earthquake | 6.0 | 4.5 | 0.050 | 39.0 | 2021-12-04 23:47:57.708000+00:00 |
| ... | ... | ... | ... | ... | ... | ... | ... | ... | ... | ... | ... | ... | ... | ... | ... | ... | ... | ... |
| 10160 | 1950-01-30T00:56:35.000Z | -53.4720 | -71.0730 | 15.00 | 6.8 | mw | NaN | NaN | NaN | iscgem895172 | 2020-07-10T08:28:24.152Z | 36 km SSW of Punta Arenas, Chile | earthquake | NaN | NaN | NaN | NaN | 1950-01-30 00:56:35+00:00 |
| 10161 | 1950-01-10T03:05:40.000Z | 10.0310 | -103.9640 | 15.00 | 6.1 | mw | NaN | NaN | NaN | iscgem895126 | 2015-05-13T18:52:45.000Z | northern East Pacific Rise | earthquake | NaN | NaN | NaN | NaN | 1950-01-10 03:05:40+00:00 |
| 10162 | 1950-01-03T11:06:28.000Z | -45.7980 | -77.0770 | 15.00 | 6.3 | mw | NaN | NaN | NaN | iscgem895109 | 2015-05-13T18:52:45.000Z | Off the coast of Aisen, Chile | earthquake | NaN | NaN | NaN | NaN | 1950-01-03 11:06:28+00:00 |
| 10163 | 1950-01-03T02:51:56.000Z | 17.5760 | 121.4280 | 30.00 | 6.5 | mw | NaN | NaN | NaN | iscgem895106 | 2020-07-10T08:27:36.136Z | 12 km NNW of Tabuk, Philippines | earthquake | NaN | NaN | NaN | NaN | 1950-01-03 02:51:56+00:00 |
| 10164 | 1950-01-02T15:14:37.000Z | -11.2420 | 165.0060 | 15.00 | 6.1 | mw | NaN | NaN | NaN | iscgem895104 | 2015-05-13T18:52:45.000Z | 103 km WSW of Lata, Solomon Islands | earthquake | NaN | NaN | NaN | NaN | 1950-01-02 15:14:37+00:00 |
10095 rows × 18 columns
Now that the data is clean we can do some simple calculations to find the average number of 6.0+ earthquakes per day. Just divide the number of earthquakes by the number of days in the time period. Take the reciprocal of tht to get the average number of days between earthquakes.
time_period = after1950['datetime'].max() - after1950['datetime'].min()
frequency = 1.0 * len(after1950) / time_period.days
print("Average number of 6.0+ earthquake events per day: " + str(frequency))
print("Average number of days between 6.0+ earthquake events: " + str(1/frequency))
Average number of 6.0+ earthquake events per day: 0.3841178037365397
Average number of days between 6.0+ earthquake events: 2.6033680039623577
We can do the same thing again but with different magnitude ranges this time.
arr = [6.0,6.5,7.0,7.5,8.0,8.5,9.0]
for i in arr:
    major = after1950.loc[after1950['mag'] >= i]
    time_period = major['datetime'].max() - major['datetime'].min()
    frequency = 1.0 * len(major) / time_period.days
    print("Average number of days between " + str(i) + "+ earthquake events: " + str(1/frequency))
    print("Average number of years between " + str(i) + "+ earthquake events: " + str(1/frequency/365))
Average number of days between 6.0+ earthquake events: 2.6033680039623577
Average number of years between 6.0+ earthquake events: 0.007132515079348925
Average number of days between 6.5+ earthquake events: 8.57917074763304
Average number of years between 6.5+ earthquake events: 0.02350457739077545
Average number of days between 7.0+ earthquake events: 27.172020725388602
Average number of years between 7.0+ earthquake events: 0.07444389239832494
Average number of days between 7.5+ earthquake events: 87.06312292358804
Average number of years between 7.5+ earthquake events: 0.2385291039002412
Average number of days between 8.0+ earthquake events: 418.2258064516129
Average number of years between 8.0+ earthquake events: 1.145824127264693
Average number of days between 8.5+ earthquake events: 1876.5833333333335
Average number of years between 8.5+ earthquake events: 5.1413242009132425
Average number of days between 9.0+ earthquake events: 4262.0
Average number of years between 9.0+ earthquake events: 11.676712328767124
It's amazing how common the lower magnitude earthquakes are and how rare the higher magnitude earthquakes are. The average number of days between earthquakes also appear to grow exponenetially as you increase the minimum magnitude.
arr = [6.0,6.5,7.0,7.5,8.0,8.5,9.0]
avg_days = []
for i in arr:
    major = after1950.loc[after1950['mag'] >= i]
    time_period = major['datetime'].max() - major['datetime'].min()
    frequency = 1.0 * len(major) / time_period.days
    avg_days.append(1/frequency)


plt.figure(figsize=(10,5))
plt.plot(arr, avg_days, 'bo', markersize=3)
plt.xlabel('Magnitude')
plt.ylabel('Average number of days')
plt.title('Average number of days between earthquakes higher than a certain magnitude')
plt.show()

So far, we have determined from previous graphs which areas are locations for frequent earthquakes and how frequent earthquakes are globally. However, say you wanted to go to Japan for a month for vacation and wanted to know how frequent the earthquakes are. The above plot doesn't help very much if you are concerned about how regular earthquakes are in an area. So let's narrow down the table to only include earthquakes in Japan.
arr = [6.0,6.5,7.0,7.5,8.0]
avg_days = []
after1950 = after1950.loc[after1950['place'].notna()]
after1950 = after1950.loc[(after1950['place'].str.contains("Japan"))]

for i in arr:
    major = after1950.loc[after1950['mag'] >= i]
    time_period = major['datetime'].max() - major['datetime'].min()
    frequency = 1.0 * len(major) / time_period.days
    print("Average number of days between " + str(i) + "+ earthquake events: " + str(1/frequency))
    print("Average number of years between " + str(i) + "+ earthquake events: " + str(1/frequency/365))
Average number of days between 6.0+ earthquake events: 31.974390243902434
Average number of years between 6.0+ earthquake events: 0.08760106916137653
Average number of days between 6.5+ earthquake events: 106.10121457489879
Average number of years between 6.5+ earthquake events: 0.29068825910931173
Average number of days between 7.0+ earthquake events: 332.71794871794873
Average number of years between 7.0+ earthquake events: 0.9115560238847911
Average number of days between 7.5+ earthquake events: 993.0
Average number of years between 7.5+ earthquake events: 2.7205479452054795
Average number of days between 8.0+ earthquake events: 4311.2
Average number of years between 8.0+ earthquake events: 11.811506849315068
Typically after a large earthquake, there are aftershocks, which are smaller earthquakes near the epicenter of the main earthquake. There should be a relatively high number of earthquakes that occur afterwards then. Our loose definition of an aftershock is going to be an earthquake that occurred at least within 10 days of the main earthquake and is no further away from the epicenter of the main earthquake by 1 degree. We're going to investigate if there's a relationship between the magnitude of the main earthquake and the number of aftershocks it produces.
This time we are using earthquake data from a rectangular region around Japan with a lower minimum magnitude. This is so we can see smaller aftershocks that are under 6.0. I am still using the same website to collect the data: https://earthquake.usgs.gov/earthquakes/search/.
The options if you want to reproduce the results are:
[30.902,45.706] Latitude
[128.848, 145.459] Longitude
1990-01-01 00:00:00 - 2021-12-19 23:59:59 Time
4.5+ Magnitude
frame = pd.read_csv('query (4).csv')
frame = frame.loc[frame['type'] == 'earthquake']
frame = frame.drop(columns=['status','locationSource','magSource','net','nst'])
# Converting the time column into datetime format for easier manipulation later
frame['datetime'] = pd.to_datetime(frame['time'])

# Different DataFrame to limit the rows based on magnitude
a = frame.loc[frame['mag'] >= 7.5]
a
| time | latitude | longitude | depth | mag | magType | gap | dmin | rms | id | updated | place | type | horizontalError | depthError | magError | magNst | datetime | |
|---|---|---|---|---|---|---|---|---|---|---|---|---|---|---|---|---|---|---|
| 7048 | 2011-03-11T06:25:50.300Z | 38.058 | 144.590 | 18.6 | 7.70 | mwc | 10.8 | NaN | 0.85 | usp000hvpg | 2021-10-20T17:56:30.784Z | 272 km ESE of Kamaishi, Japan | earthquake | NaN | 8.0 | NaN | NaN | 2011-03-11 06:25:50.300000+00:00 |
| 7053 | 2011-03-11T06:15:40.280Z | 36.281 | 141.111 | 42.6 | 7.90 | mwc | 48.4 | NaN | 1.44 | usp000hvpa | 2020-09-21T17:17:07.287Z | 47 km E of ?arai, Japan | earthquake | NaN | 9.6 | NaN | NaN | 2011-03-11 06:15:40.280000+00:00 |
| 7068 | 2011-03-11T05:46:24.120Z | 38.297 | 142.373 | 29.0 | 9.10 | mww | 9.5 | NaN | 1.16 | official20110311054624120_30 | 2021-02-16T15:22:39.454Z | 2011 Great Tohoku Earthquake, Japan | earthquake | NaN | NaN | NaN | NaN | 2011-03-11 05:46:24.120000+00:00 |
| 8508 | 2003-09-25T19:50:06.360Z | 41.815 | 143.910 | 27.0 | 8.16 | mww | NaN | NaN | NaN | official20030925195006360_27 | 2020-08-24T19:43:12.670Z | 134 km SSW of Kushiro, Japan | earthquake | NaN | NaN | NaN | NaN | 2003-09-25 19:50:06.360000+00:00 |
| 10295 | 1994-12-28T12:19:23.030Z | 40.525 | 143.419 | 26.5 | 7.80 | mw | NaN | NaN | 1.10 | usp0006qh3 | 2020-07-08T00:17:29.820Z | off the east coast of Honshu, Japan | earthquake | NaN | NaN | NaN | NaN | 1994-12-28 12:19:23.030000+00:00 |
| 10611 | 1993-07-12T13:17:11.960Z | 42.851 | 139.197 | 16.7 | 7.70 | mw | NaN | NaN | 1.00 | usp0005w12 | 2020-08-14T09:43:49.116Z | 107 km W of Iwanai, Japan | earthquake | NaN | NaN | NaN | NaN | 1993-07-12 13:17:11.960000+00:00 |
| 10718 | 1993-01-15T11:06:05.950Z | 43.300 | 143.691 | 102.2 | 7.60 | mw | NaN | NaN | 1.50 | usp0005ktj | 2020-08-29T02:03:50.733Z | 52 km NE of Otofuke, Japan | earthquake | NaN | NaN | NaN | NaN | 1993-01-15 11:06:05.950000+00:00 |
fig = gmaps.figure()

# Iterating through each row of a, which contains all earthquakes of 7.5+ magnitudes
for i,series in a.iterrows():
    # Time interval based on the time the earthquake ocurred
    b = series['datetime'] - datetime.timedelta(days=0)
    c = series['datetime'] + datetime.timedelta(days=10)
    # Make sure the aftershock is actually within the time interval and
    # close enough to be an aftershock and not a random earthquake
    # Get new table with these aftershocks
    tempa = frame.loc[(frame['datetime'] < c) & (frame['datetime'] > b) &
                      (abs(frame['latitude'] - series['latitude']) < 1) &
                      (abs(frame['longitude'] - series['longitude']) < 1)]

    print(str(len(tempa)) + " aftershocks   Strongest aftershock: " + str(tempa['mag'].max()) + "   Magnitude: " +
          str(series['mag']) + "  " + str(series['place']))

    latitude = np.array(tempa['latitude'])
    longitude = np.array(tempa['longitude'])
    coord = np.array((latitude,longitude)).T
    # Make sure I'm not adding a layer with nothing
    if len(coord) != 0:
        fig.add_layer(gmaps.heatmap_layer(coord))

    # Get main earthquake and add layer of marker that shows where the main earthquake is
    k = frame.loc[frame['id'] == series['id']]
    latitude = np.array(k['latitude'])
    longitude = np.array(k['longitude'])
    coord = np.array((latitude,longitude)).T
    fig.add_layer(gmaps.marker_layer(coord))
fig
286 aftershocks   Strongest aftershock: 6.3   Magnitude: 7.7  272 km ESE of Kamaishi, Japan
371 aftershocks   Strongest aftershock: 6.5   Magnitude: 7.9  47 km E of ?arai, Japan
379 aftershocks   Strongest aftershock: 6.7   Magnitude: 9.1  2011 Great Tohoku Earthquake, Japan
75 aftershocks   Strongest aftershock: 7.4   Magnitude: 8.16  134 km SSW of Kushiro, Japan
48 aftershocks   Strongest aftershock: 6.5   Magnitude: 7.8  off the east coast of Honshu, Japan
64 aftershocks   Strongest aftershock: 6.3   Magnitude: 7.7  107 km W of Iwanai, Japan
1 aftershocks   Strongest aftershock: 4.7   Magnitude: 7.6  52 km NE of Otofuke, Japan
There is a weak correlation between number of aftershocks and the earthquake's magnitude. There were a large number of aftershocks for the Great Tohoku Earthquake of 2011. But besides that, all of the other earthquakes seemed to have very random values for the number of aftershocks.
from sklearn import feature_selection
from sklearn import linear_model

frame['year'] = pd.to_numeric(frame['time'].str[0:4])
# Using sklearn linearRegression to fit a line
reg = linear_model.LinearRegression()
# Need to reformat year_arr so that it's a 2D array, with each subarray being a single year value
year_arr = frame['longitude']
mag_arr = frame['latitude']
year_arr2 = np.array([[x] for x in year_arr])
reg.fit(year_arr2, np.array(mag_arr))
prediction = reg.predict(year_arr2)


plt.plot(year_arr, mag_arr, 'go', markersize=0.5)
plt.plot(year_arr2, prediction, markersize=0.5)
plt.xlabel('Longitude')
plt.ylabel('Latitude')
plt.title('Location of Earthquakes in Japan')
plt.show()

print("Regression Coefficient: " + str(reg.coef_[0]))
print("Regression Intercept: " + str(reg.intercept_))

Regression Coefficient: 0.5006799406668342
Regression Intercept: -33.542466450000944
Earthquakes are very complicated and are essentially impossible to predict right now. It's simply not possible to predict earthquakes from the patterns of previous earthquakes, and there needs to be more data. Although we can't predict them yet, we can still gain a lot of insight into the nature of earthquakes with the help of data visualization techniques. There is an especially large number of earthquakes on convergent plate boundaries. The world is bound to get an 8.0+ magnitude earthquake about once every 11 years or so.
More earthquake data: https://data.noaa.gov/metaview/page?xml=NOAA/NESDIS/NGDC/MGG/Hazards/iso/xml/G012153.xml&view=getDataView
Deaths from earthquakes: https://data.noaa.gov/metaview/page?xml=NOAA/NESDIS/NGDC/MGG/Hazards/iso/xml/G012153.xml&view=getDataView
What are earthquakes: https://www.usgs.gov/programs/earthquake-hazards/science-earthquakes
Magnitude doesn't mean everything: https://www.usgs.gov/programs/earthquake-hazards/modified-mercalli-intensity-scale